

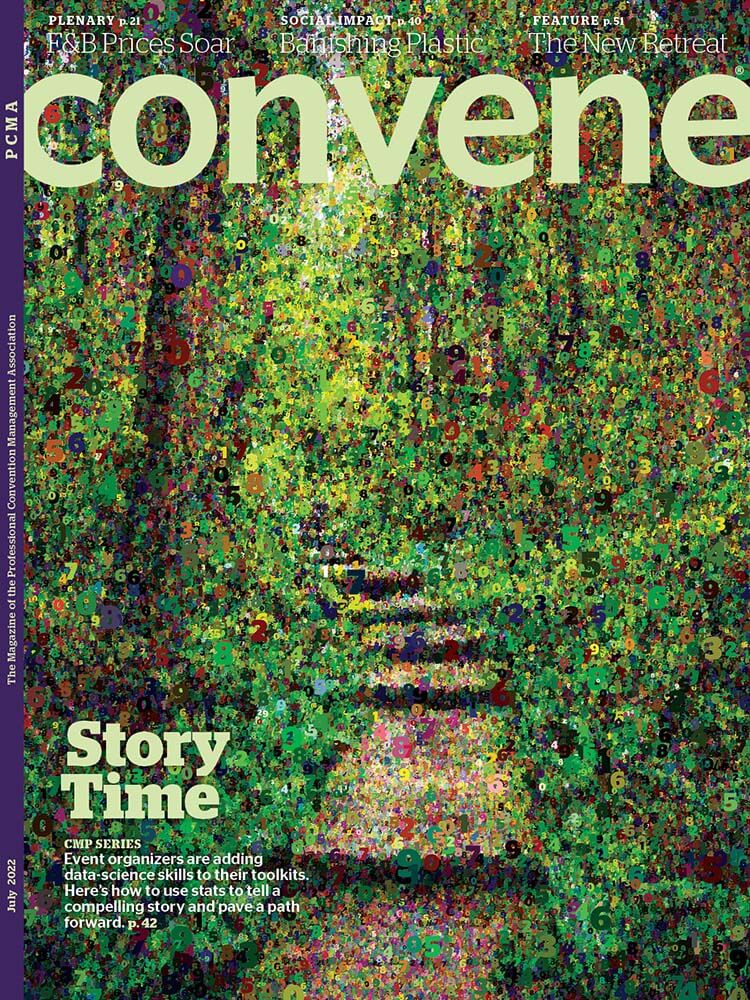
Data is not just a matter of what information you collect about your events and its participants — the most important part of the data journey is how you communicate stats and numbers to others. (Illustration by Adam Ferriss)
Editor’s note: This article is part of the Convene July 2022 cover & CMP Series story package. Find links to the other stories at the bottom of this page.
Event organizers were swimming in data before the pandemic. From information collected at their in-person events through their registration systems to their mobile apps, from social-media tools to web analytics, and from RFID badges to chatbots, there were abundant opportunities for event organizers to analyze how attendees experienced their events.
But when in-person events moved online during the pandemic, the volume of data available to organizers probably jumped tenfold, estimates Joe Colangelo, founder and CEO of Arlington, Virginia–based events analytics company Bear Analytics. And interestingly, he told Convene, the fidelity or quality of that data became higher.

Joe Colangelo
Which means the stakes are higher for planners, and the pressure for them to develop data skills compared to before the pandemic has definitely increased, Colangelo said.
What we’ve set out to do in this article is not to provide a roadmap — what kinds of data to collect and how — as much as a lens, a way of looking at the data you collect to communicate to your stakeholders the way forward.
It’s important to remember, Colangelo said, that “data collection is not analytics. And analytics are not insights. You can have a treasure trove of data, and what typically happens with it? It gets exported into Excel, and then into charts, and maybe rolled up, like sessions attended over time, to get to answers to very specific questions. And then that’s often presented to someone else. Now that’s analytics, right? It’s not fun because it has to be done repeatedly, regularly, and probably feels like painful analytics. But it’s better than nothing, and it’s more impactful than just collection alone.”
Where you want to go from there, Colangelo said, is insights. “‘Insights’ is a fancy word because people can’t quantify it. What does that mean? Is it a metric?” For Colangelo, what truly “unlocks” data is going from insights to “enablement. The second you go, ‘This happened. I learned this, and then I or my team did something because of it and we improved our outcome’ — man, that’s the stickiest stuff I’ve ever seen. When our clients do that, and they go in and they see impact — like, ‘We targeted this specific group or persona from this location because the data from using Bear’s IQ told us we were deficient in that. And during our two-week campaign, we netted 25-percent more results.’ — that’s better than any training video I can record. That’s better than me explaining to them what the heck to do. Because they’re empowered and they’re enabled.
“And until you get to that point, you may always look at data as a four-letter word, frankly, because you’re either spending too much time on it or you feel like what you want is locked in a spreadsheet.”
Nancy Duarte
Wrapping Data Around a Story
It’s one thing for the results to enable you to make improvements. It’s another to create a compelling case — a story — for what the data tells you what your path forward should be. “In a business world drowning in data, the most valuable employees will be the storytellers who have the skills to explain and inspire with data,” Nancy Duarte, principal of communications agency Duarte Inc., wrote in a LinkedIn post. “If you can understand data, give it meaning, and make actionable recommendations, you make yourself an invaluable asset to your workplace and industry. Data doesn’t speak for itself; it needs a storyteller.”
When Convene Deputy Editor Barbara Palmer spoke with Duarte after she had published her fourth book, DataStory: Explain Data and Inspire Action Through Story in 2019, she echoed those sentiments. People, Duarte told Convene, are often “nervous to take a point of view on the data. They tend to want to be able to say things like ‘Let the data speak for itself.’ Then they can hide — they don’t have to take a stance on the data.”
When you decide to say, “‘You know what, I have a point of view about what I found in the data,’” Duarte said, “that’s a real career-defining moment. That’s like moving from individual contributor to a trusted advisor” because you can recommend what action needs to be taken as a result.
“Data is kind of cold and factual and objective and we use it to prove a point,” Duarte says in an on-demand webinar at duarte.com. “Story is more warm and emotional and subjective, and we use that to make meaning.” Duarte went on to illustrate the impact of wrapping data in a story, taken from a study in Dan and Chip Heath’s book Made to Stick, in which students were given data and told they had to re-present the data back to the class. Some of the students chose only to state the statistics and others chose to tell a story. Only 5 percent of the class remembered the statistics when only data was shared, but 63 percent of the class remembered them when they were shared through a story.
“Story is a very powerful communication device,” Duarte says in the webinar. “Our brain fires in certain ways when a story is being told”compared to any other form of communication. “If you take data and wrap it in the shape of a story, people will recall it more.”
Michelle Russell is editor in chief and Barbara Palmer is deputy editor of Convene.
Convene July 2022 Cover & CMP Series Package
Following are links to other articles from the July cover story:
- Event Data: Translating Numbers Into Concrete Ideas
- Making Emotions Count in Your Event Data
- Where to Start on Your Event Data Journey
- 3 Steps to Impactful Data Storytelling
RELATED CONTENT
- Nancy Duarte’s “3 Ways to Help People Understand What Your Data Means” in the Harvard Business Review
- A five-minute HBR video, “Telling Stories with Data in 3 Steps”
Learn and Earn
Earn one clock hour of certification by visiting the Convene CMP Series page to answer questions about this story and the stories listed above.
The Certified Meeting Professional (CMP) is a registered trademark of the Events Industry Council.