

Communication is the leading job skills gap, says author and presentation expert Nancy Duarte. (Courtesy Duarte Inc.)
For her latest book, communications expert and best-selling author Nancy Duarte — CEO of Duarte Inc., a design company that has created presentations for some of the world’s biggest brands — used a method that was totally different than the way she wrote her first four books. “I did everything backwards,” Duarte told Convene. “Usually I write a book, and then a course, and then a keynote. And this time I wrote a keynote, just to see if it hit a nerve. I only had to deliver it twice to realize that people were pretty freaked out about it — in a good way.”
The keynote, “How to Find and Tell Data Stories,” struck a chord, Duarte said, because it addressed a “huge” skills gap: the ability to effectively communicate with data. That evolved into the book, DataStory: Explain Data and Inspire Action Through Story, published last year.
“Data is everywhere, every kind of data, and it’s useless if it doesn’t have a communicator,” Duarte said. Yet, “communication is the No. 1 skill missing in business,” she added, citing research from a LinkedIn study that compared job openings to the skill sets of candidates available to fill them. Communication was deemed such a crucial job skill in the study, that LinkedIn’s CEO Jeff Weiner concluded that “people with strong communication skills will not be replaced by emerging technology such as artificial intelligence,” she writes in DataStory.
 Subscribe to Convene.
Want deep-dive insights on events delivered to your inbox? Sign up for our newsletters
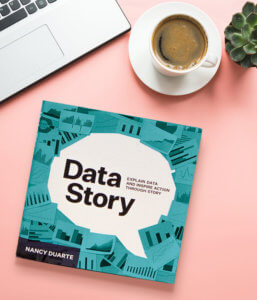
DataStory: Explain Data and Inspire Action Through Story
Almost every role today is impacted by data, as Duarte explained in a YouTube video on her website. In fact, Duarte noted, a PwC study indicates that 67 percent of roles today are enabled by data. Therefore, how you handle — and present — data can have a major impact on your career trajectory. “So, picture that when you start, you learn to explore the data,” she says in the video. “You become an explorer of the data. Once you become an explainer of the data, that’s a really big career leap. You go from being an individual contributor as an explorer of the data — and then you become a strategic advisor as you learn how to explain it well. And sure enough, when you explain your ideas in the data well, and you take a point of view — and it’s true — you move from strategic advisor to even leader.”
Why Stories?
The art of storytelling — including using vivid language, introducing characters listeners care about, and creating emotional story arcs with conflicts and resolutions — is key to effective communication because the human brain is wired to process stories. In DataStory, Duarte cites research from the book Made to Stick by Chip and Dan Heath, based on an experiment Chip did with his Stanford students to test the memorability of facts versus stories. Students were asked to give a one-minute speech about crime using statistics he provided.
The typical student used 2.5 statistics and only one in 10 told a story. In the next part of the study, students were asked to recall the speeches — only 5 percent could remember a specific statistic while 63 percent remembered the stories.
Technology has advanced to the point where “every person, place, or thing or idea, can be measured and tracked in some way,” Duarte writes, but without identifying the story emerging from the data, it’s of little or no value. “We don’t put enough narrative with almost any [data],” she told Convene. “By transforming numbers into narratives and structuring your delivery in the shape of a story, you’ll make your audience care about what your data says.”
Among the pro tips that Duarte offers for telling effective data stories are:
› Attach data to something relatable. The scale of the numbers that we talk about today is huge, Duarte said. “Huge. We’re talking billions and billions. We just throw those words around. Politicians even throw ‘trillions’ around like that’s a normal number — and it’s gargantuan.” Attaching data to something familiar to the audience is one way to make it comprehensible, she said. “Some people will express data by saying, ‘That’s eight trips to the moon and back.’ Well, how far is the moon? I don’t know, I’ve not been to the moon.”
Instead, compare data to an everyday thing that people understand, and attach the magnitude of your numbers to that relatable thing, she said, such as driving a car across the United States and back.
› Talk about humans and data. Technology can cause us to lose sight of the fact that data represents human desires and problems. Think of the people behind the data as characters in your data story, she advises, either heroes that move data in a desirable direction or adversaries that obstruct goals. “Most of the data we collect are generated by humans — whether it’s by the internet of things, in clicks, or by digital patient records,” she said. “Telling a story about the humans that are in the data is another way to make the data really stick.”
› Leverage time when presenting data. You don’t have to share all of your data at one time on one screen or chart, she said. Create surprise during a presentation, by revealing data, and then adding additional context that gives it a different meaning. Build in suspense as you share data, Duarte said, “so there’s a kind of cathartic release when they see how the data landed.”
For information about DataStory: Explain Data and Inspire Action Through Story, see duarte.com/datastory.
Barbara Palmer is Convene’s deputy editor.