Communicating data is better done through storytelling, says author and presentation expert Nancy Duarte. (Courtesy Duarte Inc.)
Technology has advanced to the point where “every person, place, or thing or idea, can be measured and tracked in some way,” Nancy Duarte writes in her 2019 book DataStory: Explain Data and Inspire Action Through Story. But without identifying the story emerging from the data, she writes, it’s of little or no value.
Duarte, principal of communications agency Duarte Inc., offers three steps to using a story structure to share data, which she explains in a webinar at duarte.com. Event professionals looking to get more from their data may find them helpful. They are:
Form a Point of View
What is it you think needs to happen because you looked in the data and you found a problem and an opportunity? This involves intuition and trusting your gut. When you make a recommendation, be sure to share what’s at stake. Duarte provided this example: “We need to disrupt the status quo by investing in xyz, or we’ll continue to lose market share.”
Structure as a Story in Three Acts
Your story should have a beginning: “There is a problem or opportunity in the current state”; a middle: “The data to support this is negative or positive. It is messy to solve”; and an end: “There is a solution that leads to a happy ending.” That is your recommendation.
Humanize the Hero in the Data
Who are the characters that made the numbers go up or down? The hero is a likeable person who has a goal (for events, that could be the attendee). The adversary is the person or thing obstructing attainment of the hero’s goal — it could be a competitor, technology, or a mindset.
MORE TIPS: Nancy Duarte shared more tips about data storytelling with Convene in 2020.
Michelle Russell is editor in chief of Convene.

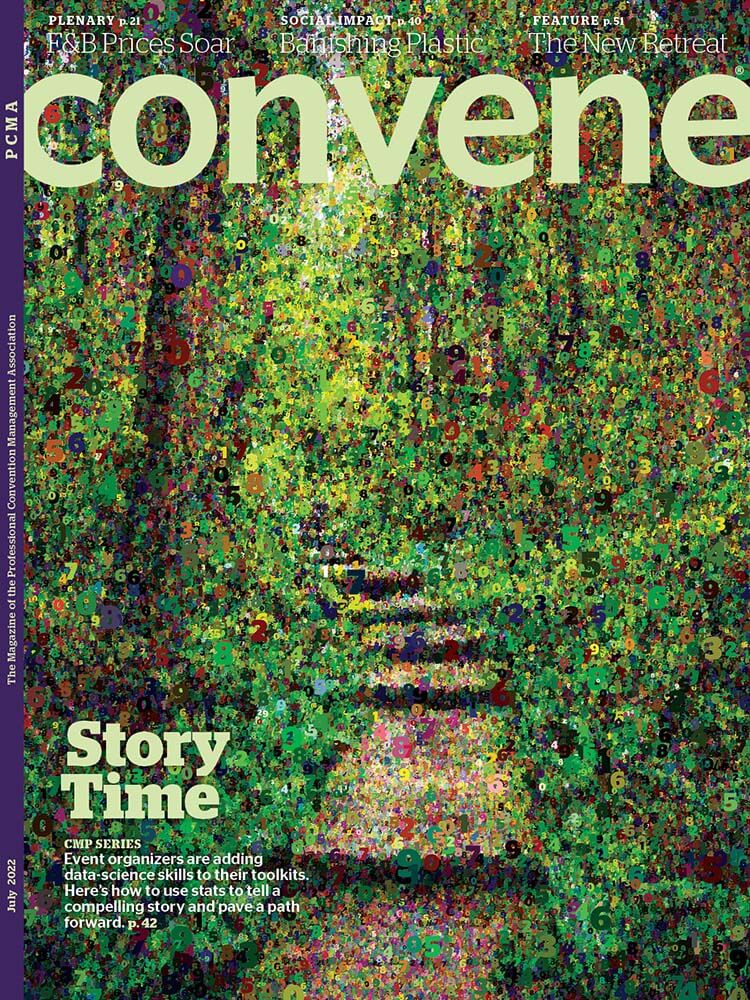
Convene July 2022 Cover & CMP Series Package
Following are links to other articles from the July cover story:
- Using Event Data to Chart a Path Forward
- Event Data: Translating Numbers Into Concrete Ideas
- Making Emotions Count in Your Event Data
- Where to Start on Your Event Data Journey
RELATED CONTENT
- Nancy Duarte’s “3 Ways to Help People Understand What Your Data Means” in the Harvard Business Review
- A five-minute HBR video, “Telling Stories with Data in 3 Steps”
