

Because our Salary Survey 2020 was conducted before COVID-19 changed the world, the results gives a snapshot of a healthy business events industry pre-pandemic. (Vectors Market/Noun Project)
When we invited event organizers to participate in Convene’s Annual Salary Survey, it was the third week in February. The vast majority of our 628 respondents took the survey less than two weeks after the World Health Organization (WHO) gave the coronavirus that originated in Wuhan, China, an official name: COVID-19. On Feb. 23, two days before 525 event professionals answered our questionnaire, Italy had just closed schools, businesses, and restaurants in a dozen northern towns following reports of two deaths tied to the coronavirus in the region. The likelihood of that happening in the U.S., where more than 90 percent of the respondents live, seemed remote.
Only 6 percent of respondents filled out the survey during March — and a mere five individuals after March 15, when the Centers for Disease Control and Prevention (CDC) advised that there should be no gatherings of 50 or more people taking place in the U.S. for eight weeks.
The results of this survey make it crystal clear that while event professionals took part in the survey at a time when COVID-19 was in the news, it wasn’t necessarily occupying their thoughts or affecting them personally or professionally. Only five respondents mentioned the coronavirus being of concern in their open-ended comments, and only a handful brought up a need to become more skilled in producing digital events.
The pandemic changed all of that seemingly overnight. As of mid-May, there are 4.4 million reported cases of coronavirus — and 300,000 deaths — worldwide. In the U.S. alone, 86,000 people have died.
As for the economic toll the coronavirus has taken on the business events industry, we are still figuring that out. We don’t yet have data on how many event organizers have been furloughed, laid off, or lost business or clients. The future is uncertain and absent a vaccine or effective treatment for COVID-19, we don’t know what the events landscape — and the shifting role of business events professional — looks like in the near future.
We do know that this survey provides a snapshot of a healthy profession pre-pandemic, where the proposition of face-to-face events seemed rock solid and its outlook was very bright. And while it may take some time to work our way back up to the salaries and level of productivity respondents to this survey indicated, perhaps these results can be used as a point of reference — a target to aim for in restoring salaries and confidence as we remake the industry.
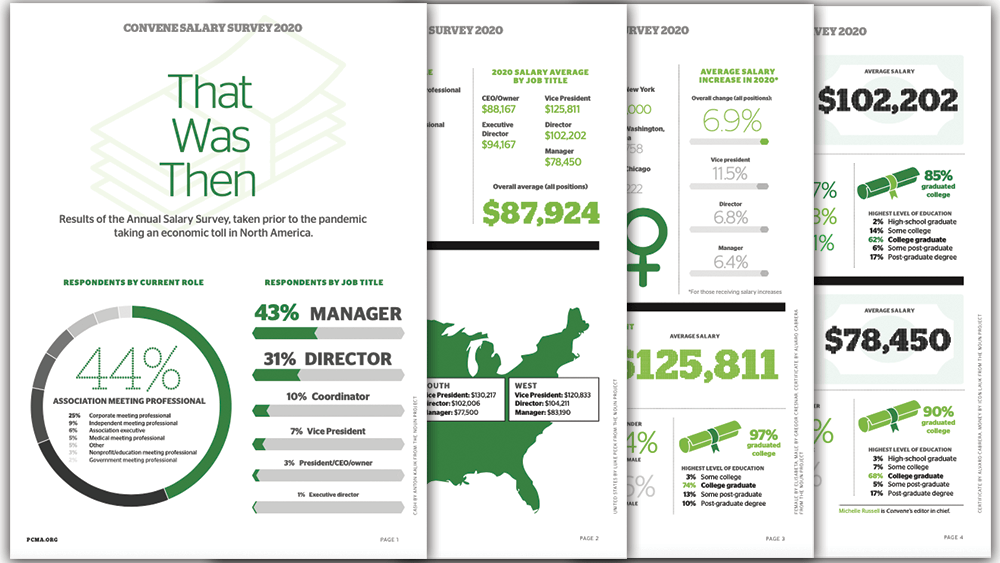
Here’s a look at where things stood for event organizers in late February and early March. For the complete picture, download our Salary Survey 2020 PDF.
Age and Experience
The average respondent is 44 years old with 10 years of experience. Fifty-eight percent of respondents are age 40 and older; 66 percent have more than 10 years of meeting-management experience. Eighty-seven percent are female; 13 percent are male.
Pay and Experience
The average salary for all meeting professionals is $87,924, up more than $5,000 from last year’s average of $82,769. The average salary for those with 1–3 years of experience is $52,917; 4–5 years, $69,362; 6–8 years, $73,291; 9–10 years, $78,611; and 10-plus years, $96,518.
Higher Ed
Sixty-seven percent of respondents have earned a college degree; 15 percent have an advanced degree.
Credentials
Of those respondents that have earned a designation, 88 percent have earned the CMP (Certified Meeting Professional) designation; 6 percent have earned a CMM (Certification in Meeting Management); 5 percent have earned their CAE (Certified Association Executive); and 7 percent have earned the DES (Digital Event Strategist) credential. Respondents with a CMP earned on average nearly $8,250 more annually than their colleagues without the designation: $92,134 versus $83,893.
Want to Earn Your CMP Certification? Enroll in PCMA’s CMP Exam Prep Course
Roles
The average salary for an association executive is $111,554; association meeting professional, $85,401; corporate meeting professional, $89,401; government meeting professional, $67,500; independent meeting professional, $86,150; medical meeting professional, $84,464; and education/nonprofit meeting professional, $77,895.
Senior-level
Forty-three percent are managers, followed by directors (31 percent). Seven percent are at the VP level, and 5 percent combined are in the executive suite (CEO/president/owner/executive director). Half of respondents (51 percent) supervise a meetings staff and 29 percent of them supervise more than two employees.
Long Weeks
Respondents work an average of 45 hours per week. More than half (54 percent) put in between 41 and 50 hours a week; 17 percent are on the job 51 to 60 hours; and 5 percent are at it for more than 60 hours each week.
Compensation Factors
Respondents said their pay is in part determined by the number of meetings they oversee annually (37 percent); size/scale of their largest meeting (27 percent); number of staff who report to them (19 percent); and post-meeting metrics (17 percent).
Professional Development
Nearly three-quarters (73 percent) said their employers regularly pay for them to attend educational events, including conferences and workshops, or provide training funds for their professional development. Ten percent said the level of that support has increased, while 80 percent said it has stayed the same.
More Work
Sixty-nine percent said they have had additional responsibilities added to their job description this year and more than three quarters — 78 percent — said they have not been compensated for taking on those extra duties.
Less Than Three Out of Four
Seventy-two percent received an increase in pay within the last 12 months, the same as last year’s survey. Only 3 percent of respondents said their salaries decreased in the past 12 months. Forty-two percent reported that their salary increased by less than 5 percent; 14 percent said it increased by 5 to 9.9 percent; and 15 percent received increases of 10 percent or higher. Twenty-six percent — around the same as in last year’s survey — said their salaries remained flat. For just the respondents who received a salary increase, 57 percent received a raise of less than 5 percent; 19 percent said their salaries increased by 5 to 9.9 percent; and 20 percent had a boost in pay of 10 percent or more. Raises were primarily due to regular salary increases (69 percent); 18 percent received a promotion this year. Fifty-eight percent said they expect to get a raise within the next year.
Steady Increases
The average salary increase of 6.95 percent for those who received a raise is only slightly under last year’s average of 7.22 percent (as reported in our 2019 survey). The average increase in salary for all respondents is 4.37 percent compared to 4.64 percent in the 2019 survey. The average salary for all respondents is $87,924 — more than $5,000 greater than last year’s survey average of $82,769.
Salary Ranges
Nearly seven planners out of 10 planners (69 percent) said they earn $70,000 or more annually. Annual compensation ranges: $30,000–$39,999, 1 percent; $40,000–$49,999, 6 percent; $50,000–$59,999, 10 percent; $60,000– $69,999, 14 percent; $70,000–$84,999, 22 percent; $85,000 to $99,999, 16 percent; $100,000–$124,999, 15 percent; $125,000 or more, 16 percent.
Half Full
Nearly half of respondents (49 percent) reported that they were satisfied with their current salary; 37 percent expressed dissatisfaction. Sixty-eight percent of respondents said they are satisfied with their specific jobs, and 87 percent said that they are satisfied with the meetings profession as a whole.
Office Locations
While 96 percent respondents work at locations throughout North America, they are most likely to be based in the Washington, D.C., area (28 percent), followed by the Chicago market (15 percent), the New York City area (6 percent), and Canada (5 percent). Forty-three percent of respondents live and work in other areas of North America. Here’s the geographic breakdown: Northeast, 14 percent; Midwest/Central, 27 percent; South, 39 percent; West, 12 percent; Canada and other non-U.S. areas, 9 percent.
Gathering Spots
Most (93 percent) of the respondents plan meetings in the United States; 30 percent in Canada; 24 percent in Europe; 13 percent in Mexico; 12 percent in Asia; 11 percent in the Caribbean and/or Bermuda; 9 percent in Australia/Pacific Rim; 8 percent in South America; 5 percent in the Middle East; and 5 percent in Africa.
Michelle Russell is Convene’s editor in chief.